[From: ]
Chrome’s developer tools (also known as the WebKit inspector) are super useful for web developers. If you aren't ramped up already, take a look at this . Also check out some of many online resources, such as the , which is quite readable, and this from Paul Irish.
But let’s not get sidetracked here. I wasn't going to write about using the developer tools, it’s about developing developer tools. There are two ways to go:
-
You can extend the tools by writing chrome extensions that use the new
chrome.experimental.devtoolsAPIs. These recently created APIs are still subject to change, and marked experimental, so it’s a bit more difficult to distribute and install them compared to other chrome extension APIs (more on this later). -
You can quite easily hack the devtools code yourself, to customize it to your needs. Then, if you do a really good job, you can contribute your changes back to the chromium project and feel better for being such an awesome person.
Let’s dive in, starting from the beginning.
DEVELOPER TOOLS EXTENSIONS
Chrome provides for extending the developer tools:
-
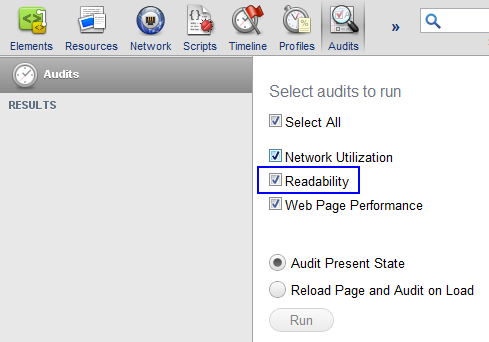
Audits - add a new audit to the Audits tab in the developer tools:
-
Panels - add a whole new panel to the developer tools:
-
Resources - access a containing known resources
There are several available as starting points, which cover all of the devtools extension API. The API is geared towards Audit-oriented extensions (HTML/CSS/Javascript validators, performance analyzers) and Panel-oriented extensions (framework specific tooling, etc). You can also write extensions that integrate more loosely with the developer tools (perhaps only using the resources API).
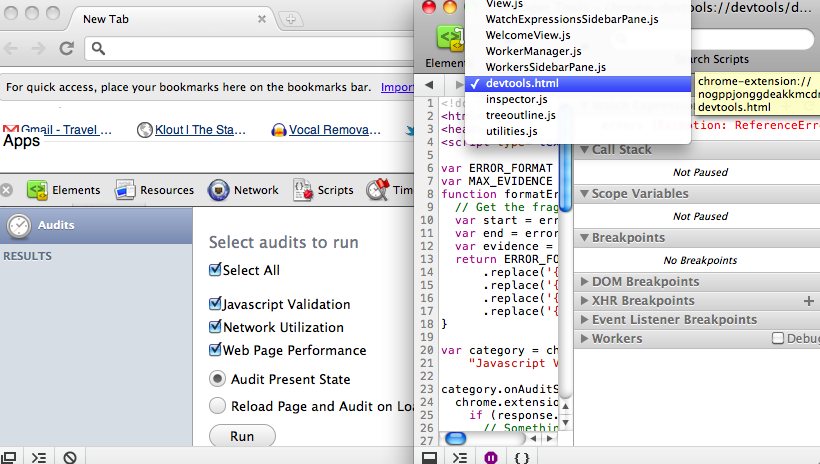
MY JSHINT AUDIT EXTENSION
I wanted to get my hands dirty, and wrote a -based Javascript validator extension. This extension uses the devtools audit API to create an audit that checks all scripts (linked and inline) on the current page. Errors are shown per-script in the audit results view. I wanted to go further, and allow the user to click on the error and jump to the resource, but this wasn’t possible with the developer tools extension API. To get around this limitation, I patched the developer tools with a pretty quick fix. More on modifying the devtools themselves later.
Check out the JSHint audit extension .
WRITING AN EXTENSION
The first thing you should know about developer tools extensions, is that (at the time of writing), they are experimental. This means that you will need to launch chrome with a special flag to use them. I use a shell script called chrome-devtools in my ~/bin (which is in my$PATH of course):
/Applications/Google\ Chrome\ Canary.app/Contents/MacOS/Google\ Chrome\ Canary \ --user-data-dir=/Users/smus/.chrome-devtools \ --enable-experimental-extension-apis \ --debug-devtools-frontend=/Users/smus/devtools_frontend
Let me explain these switches:
-
--user-data-dir: specifies a custom profile for your chrome (so you have a fresh profile to deal with and don’t accidentally clobber something important in your main chrome profile). -
--enable-experimental-extension-apis: turns on experimental extension APIs. -
More on the last switch later.
By the way, all of chrome’s switches are explained on , provided by Peter Beverloo.
Developer tools extensions are based on a devtools page, which gets loaded when the devtools open. You can specify this page in the manifest like other pages (such as background and options pages):
{ // manifest start "devtools_page": "devtools.html", // manifest end} The API favors extensions that are built around an Audit or a Panel, and you are free to use the resources API, as well as the rest of the chrome extension features.
One important note is that the devtools page has very limited access to chrome extension APIs, so you need to use and a background page to access the full chrome API.
devtools.html:
// Send request to the background pagechrome.extension.sendRequest({}, function(response) { // Handle response}); background.html:
chrome.extension.onRequest.addListener(function(request, sender, callback) { // Call some chrome extension APIs. For example, chrome.tabs.getSelected(null, function(tab) { // Etc... and then callback to devtools.html callback({data: tab.id}); });}); DEBUGGING DEVTOOLS EXTENSIONS
When writing Chrome extensions, you have the power of the Chrome developer tools at your disposal. You can debug content scripts by inspecting the page into which the Javascript has been injected. Background pages can be viewed by running chrome://extensions in developer mode, and clicking on background.html for your extension.
However, when you write a developer tools extension, you rely on this devtools_page as well as the rest of the extension ecosystem. Debugging this page can get a bit meta – just inspect the devtools with the devtools!
Now you can inspect your devtools.html page, and debug away!
CHANGING THE PRODUCT ITSELF
In addition to being highly extensible via Chrome extensions, the devtools are also pretty easy to modify and tinker with. As you noticed earlier, the tools are a web application written in Javascript, CSS and HTML, and thus inspectable by the devtools themselves. This web application is hidden inside Chrome, but luckily Chrome makes it easy to run a custom version of it. Basically, it takes three steps:
- Download a (pre-packed version of devtools). You will need to drill down into a directory for .
- Extract the zip to some directory,
DIR. - Invoke Chrome with the
--debug-devtools-frontend=DIRswitch, specifying the same directory as in the previous step.
Since the devtools_frontend.zip has some dependencies on Chrome, your zip file and chrome version should be pretty close, or you may run into problems. You can run the exact same version by also downloading the chrome-platform.zip.
Note: the Chromium project has a more detailed for getting started.
MAKING IT YOUR OWN
Now that you have your custom devtools frontend, you can make tweaks to the JS/CSS/HTML source, and see those changes in your development version of chrome after you manually restart the browser.
For example, a bunch of people wanted to get rid of the yellow highlight that appears overlaid in the browser window when hovering over DOM elements. At the time of writing, the method responsible for this is in inspector.js called WebInspector.highlightDOMNode. By applying this small patch, you can disable the default behavior.
1150,1151c1150< // Do not highlight the DOM node.< //this.highlightDOMNodeForTwoSeconds(nodeId);---> this.highlightDOMNodeForTwoSeconds(nodeId);
You can also easily make cosmetic tweaks to the devtools by changing the CSS. A lot of the base styles are implemented in inspector.css. For instance, for presentation purposes, the devtools are a bit small, so I find it useful to increase the size of the devtools, which is a one line CSS change.
There's already a ton of useful features packed into the devtools, but I bet you can come up with some more awesomeness to add as an extension or chromium patch. Let me know if you do!